


2018 Fiesta Active
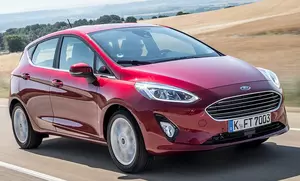
2017 Fiesta VIII (Mk8)
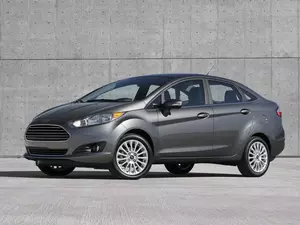
Fiesta VII Sedan (Mk7)
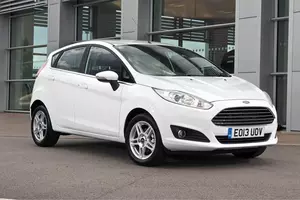
2013 Fiesta VII (Mk7, facelift 2013)
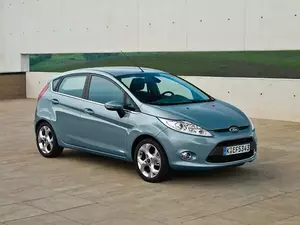
2009 Fiesta VII (Mk7)

2005 Fiesta (Mk6, 3 door facelift 2005)
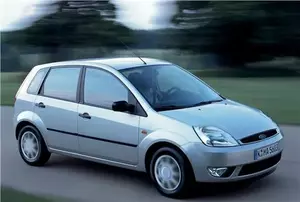
2003 Fiesta VI (Mk6, 5 door)
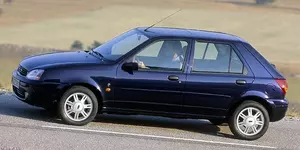
1999 Fiesta V (Mk5, 5 door)
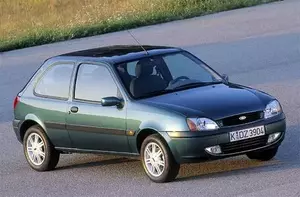
1999 Fiesta V (Mk5, 3 door)
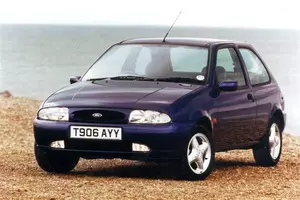
1996 Fiesta IV (Mk4, 3 door)
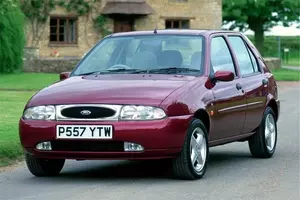
1996 Fiesta IV (Mk4, 5 door)
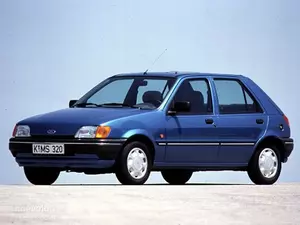
1989 Fiesta III (Mk3)

1983 Fiesta II (Mk2)

1976 Fiesta I (Mk1)
In 2018 Ford Fiesta horsepower was between 100 and 120 hp or 74 and 88 kW.
Ford Fiesta horsepower to weight ratio in 2018 is shown in the chart.
Ford Fiesta horsepower to CC ratio is shown in this graph
| Vehicle | Power (difference from average) | Power to torque ratio | Power per passenger | Power to 1 cylinder | Power to consumption rate |
|---|---|---|---|---|---|
| 1.0 EcoBoost |
100 hp / 74 kw
(-42%) |
+41% | 20 hp / 15 kw | 33 hp / 25 kw | 100 points |
| 1.5 TDCi |
120 hp / 88 kw
(-31%) |
+56% | 24 hp / 18 kw | 30 hp / 22 kw | 80 points |
| Vehicle | 1.0 EcoBoost |
|---|---|
| Power (difference from average) |
100 hp / 74 kw
(-42%) |
| Power to torque ratio | 41 % |
| Power per passenger | 20 hp / 15 kw |
| Power to 1 cylinder | 33 hp / 25 kw |
| Power to consumption rate | 100 points |
| Vehicle | 1.5 TDCi |
| Power (difference from average) |
120 hp / 88 kw
(-31%) |
| Power to torque ratio | 56 % |
| Power per passenger | 24 hp / 18 kw |
| Power to 1 cylinder | 30 hp / 22 kw |
| Power to consumption rate | 80 points |
In 2017 Ford Fiesta horsepower was between 70 and 200 hp or 51 and 147 kW.
Ford Fiesta horsepower to weight ratio in 2017 is shown in the chart.
Ford Fiesta horsepower to CC ratio is shown in this graph
| Vehicle | Power (difference from average) | Power to torque ratio | Power per passenger | Power to 1 cylinder | Power to consumption rate |
|---|---|---|---|---|---|
| 1.0 EcoBoost |
140 hp / 103 kw
(-19%) |
+22% | 28 hp / 21 kw | 47 hp / 34 kw | 140 points |
| 1.5 TDCI |
85 hp / 63 kw
(-51%) |
+60% | 17 hp / 13 kw | 21 hp / 16 kw | 56.7 points |
| 1.1 |
70 hp / 51 kw
(-60%) |
+36% | 14 hp / 10 kw | 23 hp / 17 kw | 63.6 points |
| 1.5 TDCi |
85 hp / 63 kw
(-51%) |
+60% | 17 hp / 13 kw | 21 hp / 16 kw | 56.7 points |
| ST 1.5 EcoBoost |
200 hp / 147 kw
(+16%) |
+31% | 40 hp / 29 kw | 67 hp / 49 kw | 133.3 points |
| Vehicle | 1.0 EcoBoost |
|---|---|
| Power (difference from average) |
140 hp / 103 kw
(-19%) |
| Power to torque ratio | 22 % |
| Power per passenger | 28 hp / 21 kw |
| Power to 1 cylinder | 47 hp / 34 kw |
| Power to consumption rate | 140 points |
| Vehicle | 1.5 TDCI |
| Power (difference from average) |
85 hp / 63 kw
(-51%) |
| Power to torque ratio | 60 % |
| Power per passenger | 17 hp / 13 kw |
| Power to 1 cylinder | 21 hp / 16 kw |
| Power to consumption rate | 56.7 points |
| Vehicle | 1.1 |
| Power (difference from average) |
70 hp / 51 kw
(-60%) |
| Power to torque ratio | 36 % |
| Power per passenger | 14 hp / 10 kw |
| Power to 1 cylinder | 23 hp / 17 kw |
| Power to consumption rate | 63.6 points |
| Vehicle | 1.5 TDCi |
| Power (difference from average) |
85 hp / 63 kw
(-51%) |
| Power to torque ratio | 60 % |
| Power per passenger | 17 hp / 13 kw |
| Power to 1 cylinder | 21 hp / 16 kw |
| Power to consumption rate | 56.7 points |
| Vehicle | ST 1.5 EcoBoost |
| Power (difference from average) |
200 hp / 147 kw
(+16%) |
| Power to torque ratio | 31 % |
| Power per passenger | 40 hp / 29 kw |
| Power to 1 cylinder | 67 hp / 49 kw |
| Power to consumption rate | 133.3 points |
In Fiesta Ford Fiesta horsepower was 120 hp or 88 kW
Ford Fiesta horsepower to weight ratio in Fiesta is shown in the chart.
Ford Fiesta horsepower to CC ratio is shown in this graph
| Vehicle | Power (difference from average) | Power to torque ratio | Power per passenger | Power to 1 cylinder | Power to consumption rate |
|---|---|---|---|---|---|
| 1.6 |
120 hp / 88 kw
(-31%) |
+21% | 24 hp / 18 kw | 30 hp / 22 kw | 75 points |
| Vehicle | 1.6 |
|---|---|
| Power (difference from average) |
120 hp / 88 kw
(-31%) |
| Power to torque ratio | 21 % |
| Power per passenger | 24 hp / 18 kw |
| Power to 1 cylinder | 30 hp / 22 kw |
| Power to consumption rate | 75 points |
In 2013 Ford Fiesta horsepower was between 75 and 182 hp or 55 and 134 kW.
Ford Fiesta horsepower to weight ratio in 2013 is shown in the chart.
Ford Fiesta horsepower to CC ratio is shown in this graph
| Vehicle | Power (difference from average) | Power to torque ratio | Power per passenger | Power to 1 cylinder | Power to consumption rate |
|---|---|---|---|---|---|
| ST 1.6 EcoBoost |
182 hp / 134 kw
(+5%) |
+24% | 36 hp / 27 kw | 46 hp / 34 kw | 113.8 points |
| 1.25 Duratec |
82 hp / 60 kw
(-53%) |
- | 16 hp / 12 kw | - | - |
| 1.0 Duratec |
80 hp / 59 kw
(-54%) |
- | 16 hp / 12 kw | - | - |
| 1.0 EcoBoost |
125 hp / 92 kw
(-28%) |
- | 25 hp / 18 kw | - | - |
| 1.6 TDCi |
95 hp / 70 kw
(-45%) |
- | 19 hp / 14 kw | - | - |
| 1.5 TDCi |
75 hp / 55 kw
(-57%) |
- | 15 hp / 11 kw | - | - |
| Vehicle | ST 1.6 EcoBoost |
|---|---|
| Power (difference from average) |
182 hp / 134 kw
(+5%) |
| Power to torque ratio | 24 % |
| Power per passenger | 36 hp / 27 kw |
| Power to 1 cylinder | 46 hp / 34 kw |
| Power to consumption rate | 113.8 points |
| Vehicle | 1.25 Duratec |
| Power (difference from average) |
82 hp / 60 kw
(-53%) |
| Power to torque ratio | - |
| Power per passenger | 16 hp / 12 kw |
| Power to 1 cylinder | - |
| Power to consumption rate | - |
| Vehicle | 1.0 Duratec |
| Power (difference from average) |
80 hp / 59 kw
(-54%) |
| Power to torque ratio | - |
| Power per passenger | 16 hp / 12 kw |
| Power to 1 cylinder | - |
| Power to consumption rate | - |
| Vehicle | 1.0 EcoBoost |
| Power (difference from average) |
125 hp / 92 kw
(-28%) |
| Power to torque ratio | - |
| Power per passenger | 25 hp / 18 kw |
| Power to 1 cylinder | - |
| Power to consumption rate | - |
| Vehicle | 1.6 TDCi |
| Power (difference from average) |
95 hp / 70 kw
(-45%) |
| Power to torque ratio | - |
| Power per passenger | 19 hp / 14 kw |
| Power to 1 cylinder | - |
| Power to consumption rate | - |
| Vehicle | 1.5 TDCi |
| Power (difference from average) |
75 hp / 55 kw
(-57%) |
| Power to torque ratio | - |
| Power per passenger | 15 hp / 11 kw |
| Power to 1 cylinder | - |
| Power to consumption rate | - |
In 2009 Ford Fiesta horsepower was between 75 and 105 hp or 55 and 77 kW.
Ford Fiesta horsepower to weight ratio in 2009 is shown in the chart.
Ford Fiesta horsepower to CC ratio is shown in this graph
| Vehicle | Power (difference from average) | Power to torque ratio | Power per passenger | Power to 1 cylinder | Power to consumption rate |
|---|---|---|---|---|---|
| 1.25 |
82 hp / 60 kw
(-53%) |
+28% | 16 hp / 12 kw | 21 hp / 15 kw | 68.3 points |
| 1.4 |
96 hp / 71 kw
(-45%) |
+25% | 19 hp / 14 kw | 24 hp / 18 kw | 68.6 points |
| 1.6 TDCi |
75 hp / 55 kw
(-57%) |
+59% | 15 hp / 11 kw | 19 hp / 14 kw | 46.9 points |
| 1.6 Ti-VCT |
105 hp / 77 kw
(-39%) |
- | 21 hp / 15 kw | - | - |
| 1.4 Duratec |
96 hp / 71 kw
(-45%) |
+23% | 19 hp / 14 kw | 24 hp / 18 kw | 68.6 points |
| Vehicle | 1.25 |
|---|---|
| Power (difference from average) |
82 hp / 60 kw
(-53%) |
| Power to torque ratio | 28 % |
| Power per passenger | 16 hp / 12 kw |
| Power to 1 cylinder | 21 hp / 15 kw |
| Power to consumption rate | 68.3 points |
| Vehicle | 1.4 |
| Power (difference from average) |
96 hp / 71 kw
(-45%) |
| Power to torque ratio | 25 % |
| Power per passenger | 19 hp / 14 kw |
| Power to 1 cylinder | 24 hp / 18 kw |
| Power to consumption rate | 68.6 points |
| Vehicle | 1.6 TDCi |
| Power (difference from average) |
75 hp / 55 kw
(-57%) |
| Power to torque ratio | 59 % |
| Power per passenger | 15 hp / 11 kw |
| Power to 1 cylinder | 19 hp / 14 kw |
| Power to consumption rate | 46.9 points |
| Vehicle | 1.6 Ti-VCT |
| Power (difference from average) |
105 hp / 77 kw
(-39%) |
| Power to torque ratio | - |
| Power per passenger | 21 hp / 15 kw |
| Power to 1 cylinder | - |
| Power to consumption rate | - |
| Vehicle | 1.4 Duratec |
| Power (difference from average) |
96 hp / 71 kw
(-45%) |
| Power to torque ratio | 23 % |
| Power per passenger | 19 hp / 14 kw |
| Power to 1 cylinder | 24 hp / 18 kw |
| Power to consumption rate | 68.6 points |
In 2005 Ford Fiesta horsepower was between 90 and 150 hp or 66 and 110 kW.
Ford Fiesta horsepower to weight ratio in 2005 is shown in the chart.
Ford Fiesta horsepower to CC ratio is shown in this graph
| Vehicle | Power (difference from average) | Power to torque ratio | Power per passenger | Power to 1 cylinder | Power to consumption rate |
|---|---|---|---|---|---|
| ST 2.0 Duratec HE |
150 hp / 110 kw
(-13%) |
+21% | 30 hp / 22 kw | 38 hp / 28 kw | 75 points |
| 1.6 Duratorq TDCi |
90 hp / 66 kw
(-48%) |
+56% | 18 hp / 13 kw | 23 hp / 17 kw | 56.3 points |
| Vehicle | ST 2.0 Duratec HE |
|---|---|
| Power (difference from average) |
150 hp / 110 kw
(-13%) |
| Power to torque ratio | 21 % |
| Power per passenger | 30 hp / 22 kw |
| Power to 1 cylinder | 38 hp / 28 kw |
| Power to consumption rate | 75 points |
| Vehicle | 1.6 Duratorq TDCi |
| Power (difference from average) |
90 hp / 66 kw
(-48%) |
| Power to torque ratio | 56 % |
| Power per passenger | 18 hp / 13 kw |
| Power to 1 cylinder | 23 hp / 17 kw |
| Power to consumption rate | 56.3 points |
In 2003 Ford Fiesta horsepower was between 60 and 100 hp or 44 and 74 kW.
Ford Fiesta horsepower to weight ratio in 2003 is shown in the chart.
Ford Fiesta horsepower to CC ratio is shown in this graph
| Vehicle | Power (difference from average) | Power to torque ratio | Power per passenger | Power to 1 cylinder | Power to consumption rate |
|---|---|---|---|---|---|
| 1.4 Duratec |
80 hp / 59 kw
(-54%) |
+35% | 16 hp / 12 kw | 20 hp / 15 kw | 57.1 points |
| 1.4 TDCi |
68 hp / 50 kw
(-61%) |
+58% | 14 hp / 10 kw | 17 hp / 13 kw | 48.6 points |
| 1.25 Duratec |
75 hp / 55 kw
(-57%) |
+32% | 15 hp / 11 kw | 19 hp / 14 kw | 62.5 points |
| 1.3 Duratec |
60 hp / 44 kw
(-65%) |
+39% | 12 hp / 9 kw | 15 hp / 11 kw | 46.2 points |
| 1.6 Duratec |
100 hp / 74 kw
(-42%) |
+32% | 20 hp / 15 kw | 25 hp / 19 kw | 62.5 points |
| Vehicle | 1.4 Duratec |
|---|---|
| Power (difference from average) |
80 hp / 59 kw
(-54%) |
| Power to torque ratio | 35 % |
| Power per passenger | 16 hp / 12 kw |
| Power to 1 cylinder | 20 hp / 15 kw |
| Power to consumption rate | 57.1 points |
| Vehicle | 1.4 TDCi |
| Power (difference from average) |
68 hp / 50 kw
(-61%) |
| Power to torque ratio | 58 % |
| Power per passenger | 14 hp / 10 kw |
| Power to 1 cylinder | 17 hp / 13 kw |
| Power to consumption rate | 48.6 points |
| Vehicle | 1.25 Duratec |
| Power (difference from average) |
75 hp / 55 kw
(-57%) |
| Power to torque ratio | 32 % |
| Power per passenger | 15 hp / 11 kw |
| Power to 1 cylinder | 19 hp / 14 kw |
| Power to consumption rate | 62.5 points |
| Vehicle | 1.3 Duratec |
| Power (difference from average) |
60 hp / 44 kw
(-65%) |
| Power to torque ratio | 39 % |
| Power per passenger | 12 hp / 9 kw |
| Power to 1 cylinder | 15 hp / 11 kw |
| Power to consumption rate | 46.2 points |
| Vehicle | 1.6 Duratec |
| Power (difference from average) |
100 hp / 74 kw
(-42%) |
| Power to torque ratio | 32 % |
| Power per passenger | 20 hp / 15 kw |
| Power to 1 cylinder | 25 hp / 19 kw |
| Power to consumption rate | 62.5 points |
In 1999 Ford Fiesta horsepower was between 60 and 75 hp or 44 and 55 kW.
Ford Fiesta horsepower to weight ratio in 1999 is shown in the chart.
Ford Fiesta horsepower to CC ratio is shown in this graph
| Vehicle | Power (difference from average) | Power to torque ratio | Power per passenger | Power to 1 cylinder | Power to consumption rate |
|---|---|---|---|---|---|
| 1.3 i |
60 hp / 44 kw
(-65%) |
+42% | 12 hp / 9 kw | 15 hp / 11 kw | 46.2 points |
| 1.25i 16V |
75 hp / 55 kw
(-57%) |
+32% | 15 hp / 11 kw | 19 hp / 14 kw | 62.5 points |
| 1.8 DI |
75 hp / 55 kw
(-57%) |
+46% | 15 hp / 11 kw | 19 hp / 14 kw | 41.7 points |
| 1.8 D |
60 hp / 44 kw
(-65%) |
+43% | 12 hp / 9 kw | 15 hp / 11 kw | 33.3 points |
| Vehicle | 1.3 i |
|---|---|
| Power (difference from average) |
60 hp / 44 kw
(-65%) |
| Power to torque ratio | 42 % |
| Power per passenger | 12 hp / 9 kw |
| Power to 1 cylinder | 15 hp / 11 kw |
| Power to consumption rate | 46.2 points |
| Vehicle | 1.25i 16V |
| Power (difference from average) |
75 hp / 55 kw
(-57%) |
| Power to torque ratio | 32 % |
| Power per passenger | 15 hp / 11 kw |
| Power to 1 cylinder | 19 hp / 14 kw |
| Power to consumption rate | 62.5 points |
| Vehicle | 1.8 DI |
| Power (difference from average) |
75 hp / 55 kw
(-57%) |
| Power to torque ratio | 46 % |
| Power per passenger | 15 hp / 11 kw |
| Power to 1 cylinder | 19 hp / 14 kw |
| Power to consumption rate | 41.7 points |
| Vehicle | 1.8 D |
| Power (difference from average) |
60 hp / 44 kw
(-65%) |
| Power to torque ratio | 43 % |
| Power per passenger | 12 hp / 9 kw |
| Power to 1 cylinder | 15 hp / 11 kw |
| Power to consumption rate | 33.3 points |
In 1999 Ford Fiesta horsepower was between 60 and 103 hp or 44 and 76 kW.
Ford Fiesta horsepower to weight ratio in 1999 is shown in the chart.
Ford Fiesta horsepower to CC ratio is shown in this graph
| Vehicle | Power (difference from average) | Power to torque ratio | Power per passenger | Power to 1 cylinder | Power to consumption rate |
|---|---|---|---|---|---|
| 1.3 i |
60 hp / 44 kw
(-65%) |
+42% | 12 hp / 9 kw | 15 hp / 11 kw | 46.2 points |
| 1.25i 16V |
75 hp / 55 kw
(-57%) |
+32% | 15 hp / 11 kw | 19 hp / 14 kw | 62.5 points |
| 1.8 D |
60 hp / 44 kw
(-65%) |
+43% | 12 hp / 9 kw | 15 hp / 11 kw | 33.3 points |
| 1.6 16V Sport |
103 hp / 76 kw
(-40%) |
+29% | 21 hp / 15 kw | 26 hp / 19 kw | 64.4 points |
| 1.8 DI |
75 hp / 55 kw
(-57%) |
+46% | 15 hp / 11 kw | 19 hp / 14 kw | 41.7 points |
| Vehicle | 1.3 i |
|---|---|
| Power (difference from average) |
60 hp / 44 kw
(-65%) |
| Power to torque ratio | 42 % |
| Power per passenger | 12 hp / 9 kw |
| Power to 1 cylinder | 15 hp / 11 kw |
| Power to consumption rate | 46.2 points |
| Vehicle | 1.25i 16V |
| Power (difference from average) |
75 hp / 55 kw
(-57%) |
| Power to torque ratio | 32 % |
| Power per passenger | 15 hp / 11 kw |
| Power to 1 cylinder | 19 hp / 14 kw |
| Power to consumption rate | 62.5 points |
| Vehicle | 1.8 D |
| Power (difference from average) |
60 hp / 44 kw
(-65%) |
| Power to torque ratio | 43 % |
| Power per passenger | 12 hp / 9 kw |
| Power to 1 cylinder | 15 hp / 11 kw |
| Power to consumption rate | 33.3 points |
| Vehicle | 1.6 16V Sport |
| Power (difference from average) |
103 hp / 76 kw
(-40%) |
| Power to torque ratio | 29 % |
| Power per passenger | 21 hp / 15 kw |
| Power to 1 cylinder | 26 hp / 19 kw |
| Power to consumption rate | 64.4 points |
| Vehicle | 1.8 DI |
| Power (difference from average) |
75 hp / 55 kw
(-57%) |
| Power to torque ratio | 46 % |
| Power per passenger | 15 hp / 11 kw |
| Power to 1 cylinder | 19 hp / 14 kw |
| Power to consumption rate | 41.7 points |
In 1996 Ford Fiesta horsepower was between 60 and 90 hp or 44 and 66 kW.
Ford Fiesta horsepower to weight ratio in 1996 is shown in the chart.
Ford Fiesta horsepower to CC ratio is shown in this graph
| Vehicle | Power (difference from average) | Power to torque ratio | Power per passenger | Power to 1 cylinder | Power to consumption rate |
|---|---|---|---|---|---|
| 1.25i 16V |
75 hp / 55 kw
(-57%) |
+32% | 15 hp / 11 kw | 19 hp / 14 kw | 62.5 points |
| 1.8 D |
60 hp / 44 kw
(-65%) |
+43% | 12 hp / 9 kw | 15 hp / 11 kw | 33.3 points |
| 1.3 i |
60 hp / 44 kw
(-65%) |
+43% | 12 hp / 9 kw | 15 hp / 11 kw | 46.2 points |
| 1.4 i 16V |
90 hp / 66 kw
(-48%) |
+28% | 18 hp / 13 kw | 23 hp / 17 kw | 64.3 points |
| Vehicle | 1.25i 16V |
|---|---|
| Power (difference from average) |
75 hp / 55 kw
(-57%) |
| Power to torque ratio | 32 % |
| Power per passenger | 15 hp / 11 kw |
| Power to 1 cylinder | 19 hp / 14 kw |
| Power to consumption rate | 62.5 points |
| Vehicle | 1.8 D |
| Power (difference from average) |
60 hp / 44 kw
(-65%) |
| Power to torque ratio | 43 % |
| Power per passenger | 12 hp / 9 kw |
| Power to 1 cylinder | 15 hp / 11 kw |
| Power to consumption rate | 33.3 points |
| Vehicle | 1.3 i |
| Power (difference from average) |
60 hp / 44 kw
(-65%) |
| Power to torque ratio | 43 % |
| Power per passenger | 12 hp / 9 kw |
| Power to 1 cylinder | 15 hp / 11 kw |
| Power to consumption rate | 46.2 points |
| Vehicle | 1.4 i 16V |
| Power (difference from average) |
90 hp / 66 kw
(-48%) |
| Power to torque ratio | 28 % |
| Power per passenger | 18 hp / 13 kw |
| Power to 1 cylinder | 23 hp / 17 kw |
| Power to consumption rate | 64.3 points |
In 1996 Ford Fiesta horsepower was between 50 and 75 hp or 37 and 55 kW.
Ford Fiesta horsepower to weight ratio in 1996 is shown in the chart.
Ford Fiesta horsepower to CC ratio is shown in this graph
| Vehicle | Power (difference from average) | Power to torque ratio | Power per passenger | Power to 1 cylinder | Power to consumption rate |
|---|---|---|---|---|---|
| 1.3 i |
50 hp / 37 kw
(-71%) |
+47% | 10 hp / 7 kw | 13 hp / 9 kw | 38.5 points |
| 1.25i 16V |
75 hp / 55 kw
(-57%) |
+32% | 15 hp / 11 kw | 19 hp / 14 kw | 62.5 points |
| 1.8 D |
60 hp / 44 kw
(-65%) |
+43% | 12 hp / 9 kw | 15 hp / 11 kw | 33.3 points |
| Vehicle | 1.3 i |
|---|---|
| Power (difference from average) |
50 hp / 37 kw
(-71%) |
| Power to torque ratio | 47 % |
| Power per passenger | 10 hp / 7 kw |
| Power to 1 cylinder | 13 hp / 9 kw |
| Power to consumption rate | 38.5 points |
| Vehicle | 1.25i 16V |
| Power (difference from average) |
75 hp / 55 kw
(-57%) |
| Power to torque ratio | 32 % |
| Power per passenger | 15 hp / 11 kw |
| Power to 1 cylinder | 19 hp / 14 kw |
| Power to consumption rate | 62.5 points |
| Vehicle | 1.8 D |
| Power (difference from average) |
60 hp / 44 kw
(-65%) |
| Power to torque ratio | 43 % |
| Power per passenger | 12 hp / 9 kw |
| Power to 1 cylinder | 15 hp / 11 kw |
| Power to consumption rate | 33.3 points |
In 1989 Ford Fiesta horsepower was between 55 and 133 hp or 40 and 98 kW.
Ford Fiesta horsepower to weight ratio in 1989 is shown in the chart.
Ford Fiesta horsepower to CC ratio is shown in this graph
| Vehicle | Power (difference from average) | Power to torque ratio | Power per passenger | Power to 1 cylinder | Power to consumption rate |
|---|---|---|---|---|---|
| 1.1 |
55 hp / 40 kw
(-68%) |
- | 14 hp / 10 kw | 14 hp / 10 kw | 50 points |
| 1.3 |
60 hp / 44 kw
(-65%) |
+41% | 12 hp / 9 kw | 15 hp / 11 kw | 46.2 points |
| 1.4 |
73 hp / 54 kw
(-58%) |
+31% | 15 hp / 11 kw | 18 hp / 14 kw | 52.1 points |
| 1.3 CAT |
60 hp / 44 kw
(-65%) |
- | 12 hp / 9 kw | 15 hp / 11 kw | - |
| 1.6 |
88 hp / 65 kw
(-49%) |
- | - | - | |
| 1.6 i |
110 hp / 81 kw
(-36%) |
+20% | 22 hp / 16 kw | 28 hp / 20 kw | 68.8 points |
| 1.6 i 16V |
88 hp / 65 kw
(-49%) |
+35% | 18 hp / 13 kw | 22 hp / 16 kw | 55 points |
| 1.6 i Turbo |
133 hp / 98 kw
(-23%) |
+28% | 27 hp / 20 kw | 33 hp / 25 kw | 83.1 points |
| 1.8 16V |
105 hp / 77 kw
(-39%) |
+31% | 21 hp / 15 kw | 26 hp / 19 kw | 58.3 points |
| 1.6 XR2i |
103 hp / 76 kw
(-40%) |
- | 21 hp / 15 kw | 26 hp / 19 kw | 64.4 points |
| 1.8 D |
60 hp / 44 kw
(-65%) |
+45% | 12 hp / 9 kw | 15 hp / 11 kw | 33.3 points |
| 1.8 XR2i 16V |
130 hp / 96 kw
(-25%) |
+20% | 26 hp / 19 kw | 33 hp / 24 kw | 72.2 points |
| Vehicle | 1.1 |
|---|---|
| Power (difference from average) |
55 hp / 40 kw
(-68%) |
| Power to torque ratio | - |
| Power per passenger | 14 hp / 10 kw |
| Power to 1 cylinder | 14 hp / 10 kw |
| Power to consumption rate | 50 points |
| Vehicle | 1.3 |
| Power (difference from average) |
60 hp / 44 kw
(-65%) |
| Power to torque ratio | 41 % |
| Power per passenger | 12 hp / 9 kw |
| Power to 1 cylinder | 15 hp / 11 kw |
| Power to consumption rate | 46.2 points |
| Vehicle | 1.4 |
| Power (difference from average) |
73 hp / 54 kw
(-58%) |
| Power to torque ratio | 31 % |
| Power per passenger | 15 hp / 11 kw |
| Power to 1 cylinder | 18 hp / 14 kw |
| Power to consumption rate | 52.1 points |
| Vehicle | 1.3 CAT |
| Power (difference from average) |
60 hp / 44 kw
(-65%) |
| Power to torque ratio | - |
| Power per passenger | 12 hp / 9 kw |
| Power to 1 cylinder | 15 hp / 11 kw |
| Power to consumption rate | - |
| Vehicle | 1.6 |
| Power (difference from average) |
88 hp / 65 kw
(-49%) |
| Power to torque ratio | - |
| Power per passenger | |
| Power to 1 cylinder | - |
| Power to consumption rate | - |
| Vehicle | 1.6 i |
| Power (difference from average) |
110 hp / 81 kw
(-36%) |
| Power to torque ratio | 20 % |
| Power per passenger | 22 hp / 16 kw |
| Power to 1 cylinder | 28 hp / 20 kw |
| Power to consumption rate | 68.8 points |
| Vehicle | 1.6 i 16V |
| Power (difference from average) |
88 hp / 65 kw
(-49%) |
| Power to torque ratio | 35 % |
| Power per passenger | 18 hp / 13 kw |
| Power to 1 cylinder | 22 hp / 16 kw |
| Power to consumption rate | 55 points |
| Vehicle | 1.6 i Turbo |
| Power (difference from average) |
133 hp / 98 kw
(-23%) |
| Power to torque ratio | 28 % |
| Power per passenger | 27 hp / 20 kw |
| Power to 1 cylinder | 33 hp / 25 kw |
| Power to consumption rate | 83.1 points |
| Vehicle | 1.8 16V |
| Power (difference from average) |
105 hp / 77 kw
(-39%) |
| Power to torque ratio | 31 % |
| Power per passenger | 21 hp / 15 kw |
| Power to 1 cylinder | 26 hp / 19 kw |
| Power to consumption rate | 58.3 points |
| Vehicle | 1.6 XR2i |
| Power (difference from average) |
103 hp / 76 kw
(-40%) |
| Power to torque ratio | - |
| Power per passenger | 21 hp / 15 kw |
| Power to 1 cylinder | 26 hp / 19 kw |
| Power to consumption rate | 64.4 points |
| Vehicle | 1.8 D |
| Power (difference from average) |
60 hp / 44 kw
(-65%) |
| Power to torque ratio | 45 % |
| Power per passenger | 12 hp / 9 kw |
| Power to 1 cylinder | 15 hp / 11 kw |
| Power to consumption rate | 33.3 points |
| Vehicle | 1.8 XR2i 16V |
| Power (difference from average) |
130 hp / 96 kw
(-25%) |
| Power to torque ratio | 20 % |
| Power per passenger | 26 hp / 19 kw |
| Power to 1 cylinder | 33 hp / 24 kw |
| Power to consumption rate | 72.2 points |
In 1983 Ford Fiesta horsepower was between 45 and 97 hp or 33 and 71 kW.
Ford Fiesta horsepower to CC ratio is shown in this graph
| Vehicle | Power (difference from average) | Power to torque ratio | Power per passenger | Power to 1 cylinder | Power to consumption rate |
|---|---|---|---|---|---|
| 1.0 |
45 hp / 33 kw
(-74%) |
- | 9 hp / 7 kw | 11 hp / 8 kw | 45 points |
| 1.3 |
69 hp / 51 kw
(-60%) |
- | - | - | |
| 1.1 |
50 hp / 37 kw
(-71%) |
- | - | - | |
| 1.4 |
73 hp / 54 kw
(-58%) |
- | - | - | |
| 1.6 XR2 |
97 hp / 71 kw
(-44%) |
- | - | - | |
| 1.6 D |
54 hp / 40 kw
(-69%) |
- | - | - |
| Vehicle | 1.0 |
|---|---|
| Power (difference from average) |
45 hp / 33 kw
(-74%) |
| Power to torque ratio | - |
| Power per passenger | 9 hp / 7 kw |
| Power to 1 cylinder | 11 hp / 8 kw |
| Power to consumption rate | 45 points |
| Vehicle | 1.3 |
| Power (difference from average) |
69 hp / 51 kw
(-60%) |
| Power to torque ratio | - |
| Power per passenger | |
| Power to 1 cylinder | - |
| Power to consumption rate | - |
| Vehicle | 1.1 |
| Power (difference from average) |
50 hp / 37 kw
(-71%) |
| Power to torque ratio | - |
| Power per passenger | |
| Power to 1 cylinder | - |
| Power to consumption rate | - |
| Vehicle | 1.4 |
| Power (difference from average) |
73 hp / 54 kw
(-58%) |
| Power to torque ratio | - |
| Power per passenger | |
| Power to 1 cylinder | - |
| Power to consumption rate | - |
| Vehicle | 1.6 XR2 |
| Power (difference from average) |
97 hp / 71 kw
(-44%) |
| Power to torque ratio | - |
| Power per passenger | |
| Power to 1 cylinder | - |
| Power to consumption rate | - |
| Vehicle | 1.6 D |
| Power (difference from average) |
54 hp / 40 kw
(-69%) |
| Power to torque ratio | - |
| Power per passenger | |
| Power to 1 cylinder | - |
| Power to consumption rate | - |
In 1976 Ford Fiesta horsepower was between 45 and 84 hp or 33 and 62 kW.
| Vehicle | Power (difference from average) | Power to torque ratio | Power per passenger | Power to 1 cylinder | Power to consumption rate |
|---|---|---|---|---|---|
| 0.9 |
45 hp / 33 kw
(-74%) |
- | - | - | |
| 1.1 |
54 hp / 40 kw
(-69%) |
- | - | - | |
| 1.3 |
66 hp / 49 kw
(-62%) |
- | - | - | |
| 1.6 XR2 |
84 hp / 62 kw
(-51%) |
- | - | - |
| Vehicle | 0.9 |
|---|---|
| Power (difference from average) |
45 hp / 33 kw
(-74%) |
| Power to torque ratio | - |
| Power per passenger | |
| Power to 1 cylinder | - |
| Power to consumption rate | - |
| Vehicle | 1.1 |
| Power (difference from average) |
54 hp / 40 kw
(-69%) |
| Power to torque ratio | - |
| Power per passenger | |
| Power to 1 cylinder | - |
| Power to consumption rate | - |
| Vehicle | 1.3 |
| Power (difference from average) |
66 hp / 49 kw
(-62%) |
| Power to torque ratio | - |
| Power per passenger | |
| Power to 1 cylinder | - |
| Power to consumption rate | - |
| Vehicle | 1.6 XR2 |
| Power (difference from average) |
84 hp / 62 kw
(-51%) |
| Power to torque ratio | - |
| Power per passenger | |
| Power to 1 cylinder | - |
| Power to consumption rate | - |