


2018 A8 (D5)
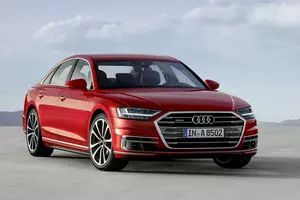
2018 A8 Long (D5)
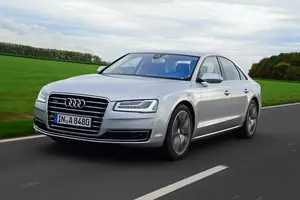
2014 A8 (D4,4H facelift 2013)
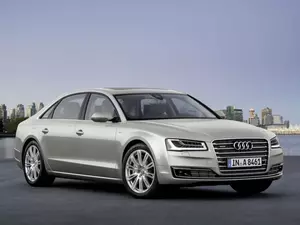
2014 A8 Long (D4,4H facelift 2013)

2011 A8 (D4, 4H)
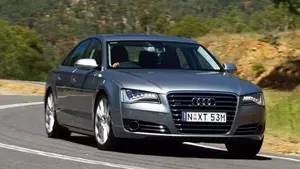
2011 A8 Long (D4, 4H)
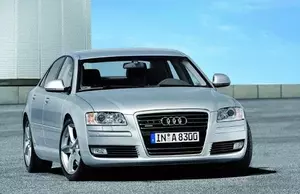
2007 A8 (D3, 4E, facelift 2007)
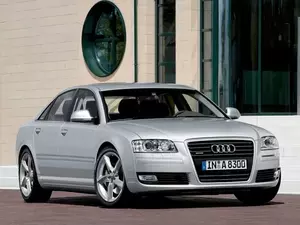
2007 A8 Long (D3, 4E, facelift 2007)
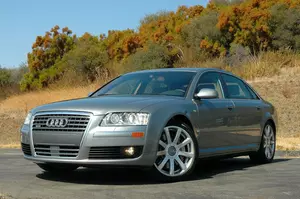
A8 (D3, 4E, facelift 2005)
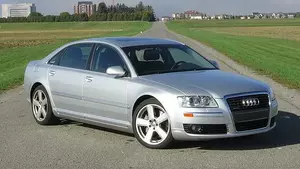
A8 Long (D3, 4E, facelift 2005)
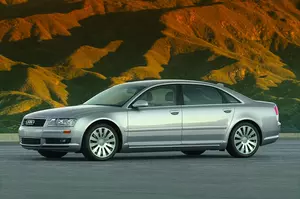
2004 A8 (D3, 4E)
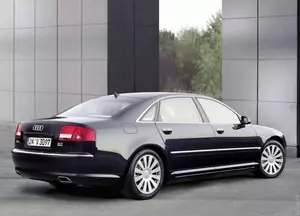
A8 Long (D3, 4E)
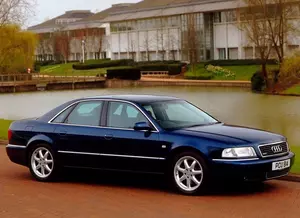
A8 Long (D2, 4D)
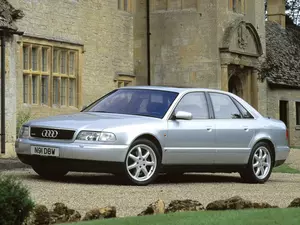
1995 A8 (D2,4D)
In 2018 Audi A8 horsepower was between 286 and 340 hp or 210 and 250 kW.
Audi A8 horsepower to weight ratio in 2018 is shown in the chart.
Audi A8 horsepower to CC ratio is shown in this graph
| Vehicle | Power (difference from average) | Power to torque ratio | Power per passenger | Power to 1 cylinder | Power to consumption rate |
|---|---|---|---|---|---|
| 50 TDI |
286 hp / 210 kw
(+65%) |
+52% | 57 hp / 42 kw | 48 hp / 35 kw | 95.3 points |
| 60 TFSI e |
340 hp / 250 kw
(+97%) |
+32% | 85 hp / 63 kw | 57 hp / 42 kw | 113.3 points |
| 55 TFSI |
340 hp / 250 kw
(+97%) |
+32% | 68 hp / 50 kw | 57 hp / 42 kw | 113.3 points |
| Vehicle | 50 TDI |
|---|---|
| Power (difference from average) |
286 hp / 210 kw
(+65%) |
| Power to torque ratio | 52 % |
| Power per passenger | 57 hp / 42 kw |
| Power to 1 cylinder | 48 hp / 35 kw |
| Power to consumption rate | 95.3 points |
| Vehicle | 60 TFSI e |
| Power (difference from average) |
340 hp / 250 kw
(+97%) |
| Power to torque ratio | 32 % |
| Power per passenger | 85 hp / 63 kw |
| Power to 1 cylinder | 57 hp / 42 kw |
| Power to consumption rate | 113.3 points |
| Vehicle | 55 TFSI |
| Power (difference from average) |
340 hp / 250 kw
(+97%) |
| Power to torque ratio | 32 % |
| Power per passenger | 68 hp / 50 kw |
| Power to 1 cylinder | 57 hp / 42 kw |
| Power to consumption rate | 113.3 points |
In 2018 Audi A8 horsepower was between 286 and 340 hp or 210 and 250 kW.
Audi A8 horsepower to weight ratio in 2018 is shown in the chart.
Audi A8 horsepower to CC ratio is shown in this graph
| Vehicle | Power (difference from average) | Power to torque ratio | Power per passenger | Power to 1 cylinder | Power to consumption rate |
|---|---|---|---|---|---|
| 55 TFSI |
340 hp / 250 kw
(+97%) |
+32% | 68 hp / 50 kw | 57 hp / 42 kw | 113.3 points |
| 60 TFSI e |
340 hp / 250 kw
(+97%) |
+32% | 68 hp / 50 kw | 57 hp / 42 kw | 113.3 points |
| 50 TDI |
286 hp / 210 kw
(+65%) |
+52% | 57 hp / 42 kw | 48 hp / 35 kw | 95.3 points |
| Vehicle | 55 TFSI |
|---|---|
| Power (difference from average) |
340 hp / 250 kw
(+97%) |
| Power to torque ratio | 32 % |
| Power per passenger | 68 hp / 50 kw |
| Power to 1 cylinder | 57 hp / 42 kw |
| Power to consumption rate | 113.3 points |
| Vehicle | 60 TFSI e |
| Power (difference from average) |
340 hp / 250 kw
(+97%) |
| Power to torque ratio | 32 % |
| Power per passenger | 68 hp / 50 kw |
| Power to 1 cylinder | 57 hp / 42 kw |
| Power to consumption rate | 113.3 points |
| Vehicle | 50 TDI |
| Power (difference from average) |
286 hp / 210 kw
(+65%) |
| Power to torque ratio | 52 % |
| Power per passenger | 57 hp / 42 kw |
| Power to 1 cylinder | 48 hp / 35 kw |
| Power to consumption rate | 95.3 points |
In 2014 Audi A8 horsepower was between 211 and 435 hp or 155 and 320 kW.
Audi A8 horsepower to weight ratio in 2014 is shown in the chart.
Audi A8 horsepower to CC ratio is shown in this graph
| Vehicle | Power (difference from average) | Power to torque ratio | Power per passenger | Power to 1 cylinder | Power to consumption rate |
|---|---|---|---|---|---|
| 2.0 |
211 hp / 155 kw
(+22%) |
+40% | 42 hp / 31 kw | 53 hp / 39 kw | 105.5 points |
| 3.0 TDI V6 |
262 hp / 193 kw
(+51%) |
+55% | 52 hp / 39 kw | 44 hp / 32 kw | 87.3 points |
| 3.0 TDI V6 ultra |
262 hp / 193 kw
(+51%) |
+55% | 52 hp / 39 kw | 44 hp / 32 kw | 87.3 points |
| 3.0 TDI V6 clean diesel |
258 hp / 190 kw
(+49%) |
+56% | 52 hp / 38 kw | 43 hp / 32 kw | 86 points |
| 4.0 BiTFSI V8 |
435 hp / 320 kw
(+151%) |
+28% | 87 hp / 64 kw | 54 hp / 40 kw | 108.8 points |
| 4.2 TDI V8 clean diesel |
385 hp / 283 kw
(+123%) |
+55% | 77 hp / 57 kw | 48 hp / 35 kw | 93.9 points |
| 3.0 TFSI V6 |
310 hp / 228 kw
(+79%) |
+30% | 62 hp / 46 kw | 52 hp / 38 kw | 103.3 points |
| Vehicle | 2.0 |
|---|---|
| Power (difference from average) |
211 hp / 155 kw
(+22%) |
| Power to torque ratio | 40 % |
| Power per passenger | 42 hp / 31 kw |
| Power to 1 cylinder | 53 hp / 39 kw |
| Power to consumption rate | 105.5 points |
| Vehicle | 3.0 TDI V6 |
| Power (difference from average) |
262 hp / 193 kw
(+51%) |
| Power to torque ratio | 55 % |
| Power per passenger | 52 hp / 39 kw |
| Power to 1 cylinder | 44 hp / 32 kw |
| Power to consumption rate | 87.3 points |
| Vehicle | 3.0 TDI V6 ultra |
| Power (difference from average) |
262 hp / 193 kw
(+51%) |
| Power to torque ratio | 55 % |
| Power per passenger | 52 hp / 39 kw |
| Power to 1 cylinder | 44 hp / 32 kw |
| Power to consumption rate | 87.3 points |
| Vehicle | 3.0 TDI V6 clean diesel |
| Power (difference from average) |
258 hp / 190 kw
(+49%) |
| Power to torque ratio | 56 % |
| Power per passenger | 52 hp / 38 kw |
| Power to 1 cylinder | 43 hp / 32 kw |
| Power to consumption rate | 86 points |
| Vehicle | 4.0 BiTFSI V8 |
| Power (difference from average) |
435 hp / 320 kw
(+151%) |
| Power to torque ratio | 28 % |
| Power per passenger | 87 hp / 64 kw |
| Power to 1 cylinder | 54 hp / 40 kw |
| Power to consumption rate | 108.8 points |
| Vehicle | 4.2 TDI V8 clean diesel |
| Power (difference from average) |
385 hp / 283 kw
(+123%) |
| Power to torque ratio | 55 % |
| Power per passenger | 77 hp / 57 kw |
| Power to 1 cylinder | 48 hp / 35 kw |
| Power to consumption rate | 93.9 points |
| Vehicle | 3.0 TFSI V6 |
| Power (difference from average) |
310 hp / 228 kw
(+79%) |
| Power to torque ratio | 30 % |
| Power per passenger | 62 hp / 46 kw |
| Power to 1 cylinder | 52 hp / 38 kw |
| Power to consumption rate | 103.3 points |
In 2014 Audi A8 horsepower was between 211 and 500 hp or 155 and 368 kW.
Audi A8 horsepower to weight ratio in 2014 is shown in the chart.
Audi A8 horsepower to CC ratio is shown in this graph
| Vehicle | Power (difference from average) | Power to torque ratio | Power per passenger | Power to 1 cylinder | Power to consumption rate |
|---|---|---|---|---|---|
| 3.0 TDI V6 clean diesel |
258 hp / 190 kw
(+49%) |
+56% | 52 hp / 38 kw | 43 hp / 32 kw | 86 points |
| 3.0 TDI V6 |
262 hp / 193 kw
(+51%) |
+55% | 52 hp / 39 kw | 44 hp / 32 kw | 87.3 points |
| 4.2 BiTDI V6 clean diesel |
385 hp / 283 kw
(+123%) |
+55% | 77 hp / 57 kw | 48 hp / 35 kw | 93.9 points |
| 6.3 FSI W12 |
500 hp / 368 kw
(+189%) |
+20% | 100 hp / 74 kw | 42 hp / 31 kw | 79.4 points |
| 3.0 TFSI V6 |
310 hp / 228 kw
(+79%) |
+30% | 62 hp / 46 kw | 52 hp / 38 kw | 103.3 points |
| 4.0 TFSI V8 |
435 hp / 320 kw
(+151%) |
+28% | 87 hp / 64 kw | 54 hp / 40 kw | 108.8 points |
| 2.0 |
211 hp / 155 kw
(+22%) |
+40% | 42 hp / 31 kw | 53 hp / 39 kw | 105.5 points |
| Vehicle | 3.0 TDI V6 clean diesel |
|---|---|
| Power (difference from average) |
258 hp / 190 kw
(+49%) |
| Power to torque ratio | 56 % |
| Power per passenger | 52 hp / 38 kw |
| Power to 1 cylinder | 43 hp / 32 kw |
| Power to consumption rate | 86 points |
| Vehicle | 3.0 TDI V6 |
| Power (difference from average) |
262 hp / 193 kw
(+51%) |
| Power to torque ratio | 55 % |
| Power per passenger | 52 hp / 39 kw |
| Power to 1 cylinder | 44 hp / 32 kw |
| Power to consumption rate | 87.3 points |
| Vehicle | 4.2 BiTDI V6 clean diesel |
| Power (difference from average) |
385 hp / 283 kw
(+123%) |
| Power to torque ratio | 55 % |
| Power per passenger | 77 hp / 57 kw |
| Power to 1 cylinder | 48 hp / 35 kw |
| Power to consumption rate | 93.9 points |
| Vehicle | 6.3 FSI W12 |
| Power (difference from average) |
500 hp / 368 kw
(+189%) |
| Power to torque ratio | 20 % |
| Power per passenger | 100 hp / 74 kw |
| Power to 1 cylinder | 42 hp / 31 kw |
| Power to consumption rate | 79.4 points |
| Vehicle | 3.0 TFSI V6 |
| Power (difference from average) |
310 hp / 228 kw
(+79%) |
| Power to torque ratio | 30 % |
| Power per passenger | 62 hp / 46 kw |
| Power to 1 cylinder | 52 hp / 38 kw |
| Power to consumption rate | 103.3 points |
| Vehicle | 4.0 TFSI V8 |
| Power (difference from average) |
435 hp / 320 kw
(+151%) |
| Power to torque ratio | 28 % |
| Power per passenger | 87 hp / 64 kw |
| Power to 1 cylinder | 54 hp / 40 kw |
| Power to consumption rate | 108.8 points |
| Vehicle | 2.0 |
| Power (difference from average) |
211 hp / 155 kw
(+22%) |
| Power to torque ratio | 40 % |
| Power per passenger | 42 hp / 31 kw |
| Power to 1 cylinder | 53 hp / 39 kw |
| Power to consumption rate | 105.5 points |
In 2011 Audi A8 horsepower was between 211 and 420 hp or 155 and 309 kW.
Audi A8 horsepower to weight ratio in 2011 is shown in the chart.
Audi A8 horsepower to CC ratio is shown in this graph
| Vehicle | Power (difference from average) | Power to torque ratio | Power per passenger | Power to 1 cylinder | Power to consumption rate |
|---|---|---|---|---|---|
| 3.0 TFSI V6 |
290 hp / 213 kw
(+68%) |
+31% | 58 hp / 43 kw | 48 hp / 36 kw | 96.7 points |
| 2.0 TFSI |
211 hp / 155 kw
(+22%) |
+40% | 42 hp / 31 kw | 53 hp / 39 kw | 105.5 points |
| 3.0 TDI V6 |
250 hp / 184 kw
(+45%) |
+55% | 50 hp / 37 kw | 42 hp / 31 kw | 83.3 points |
| 4.2 FSI V8 |
372 hp / 274 kw
(+115%) |
+16% | 74 hp / 55 kw | 47 hp / 34 kw | 88.6 points |
| 4.2 BiTDI V8 |
350 hp / 257 kw
(+102%) |
+56% | 70 hp / 51 kw | 44 hp / 32 kw | 85.4 points |
| 4.0 TFSI V8 |
420 hp / 309 kw
(+143%) |
+30% | 84 hp / 62 kw | 53 hp / 39 kw | 105 points |
| Vehicle | 3.0 TFSI V6 |
|---|---|
| Power (difference from average) |
290 hp / 213 kw
(+68%) |
| Power to torque ratio | 31 % |
| Power per passenger | 58 hp / 43 kw |
| Power to 1 cylinder | 48 hp / 36 kw |
| Power to consumption rate | 96.7 points |
| Vehicle | 2.0 TFSI |
| Power (difference from average) |
211 hp / 155 kw
(+22%) |
| Power to torque ratio | 40 % |
| Power per passenger | 42 hp / 31 kw |
| Power to 1 cylinder | 53 hp / 39 kw |
| Power to consumption rate | 105.5 points |
| Vehicle | 3.0 TDI V6 |
| Power (difference from average) |
250 hp / 184 kw
(+45%) |
| Power to torque ratio | 55 % |
| Power per passenger | 50 hp / 37 kw |
| Power to 1 cylinder | 42 hp / 31 kw |
| Power to consumption rate | 83.3 points |
| Vehicle | 4.2 FSI V8 |
| Power (difference from average) |
372 hp / 274 kw
(+115%) |
| Power to torque ratio | 16 % |
| Power per passenger | 74 hp / 55 kw |
| Power to 1 cylinder | 47 hp / 34 kw |
| Power to consumption rate | 88.6 points |
| Vehicle | 4.2 BiTDI V8 |
| Power (difference from average) |
350 hp / 257 kw
(+102%) |
| Power to torque ratio | 56 % |
| Power per passenger | 70 hp / 51 kw |
| Power to 1 cylinder | 44 hp / 32 kw |
| Power to consumption rate | 85.4 points |
| Vehicle | 4.0 TFSI V8 |
| Power (difference from average) |
420 hp / 309 kw
(+143%) |
| Power to torque ratio | 30 % |
| Power per passenger | 84 hp / 62 kw |
| Power to 1 cylinder | 53 hp / 39 kw |
| Power to consumption rate | 105 points |
In 2011 Audi A8 horsepower was between 204 and 500 hp or 150 and 368 kW.
Audi A8 horsepower to weight ratio in 2011 is shown in the chart.
Audi A8 horsepower to CC ratio is shown in this graph
| Vehicle | Power (difference from average) | Power to torque ratio | Power per passenger | Power to 1 cylinder | Power to consumption rate |
|---|---|---|---|---|---|
| 6.3 W12 |
500 hp / 368 kw
(+189%) |
+20% | 125 hp / 92 kw | 42 hp / 31 kw | 79.4 points |
| 4.1 TDI V8 |
350 hp / 257 kw
(+102%) |
+56% | 88 hp / 64 kw | 44 hp / 32 kw | 85.4 points |
| 2.0 TFSI |
211 hp / 155 kw
(+22%) |
+40% | 42 hp / 31 kw | 53 hp / 39 kw | 105.5 points |
| 3.0 TFSI V6 |
290 hp / 213 kw
(+68%) |
+31% | 58 hp / 43 kw | 48 hp / 36 kw | 96.7 points |
| 2.5 FSI V6 |
204 hp / 150 kw
(+18%) |
+18% | 41 hp / 30 kw | 34 hp / 25 kw | 81.6 points |
| 4.2 FSI V8 |
372 hp / 274 kw
(+115%) |
+16% | 74 hp / 55 kw | 47 hp / 34 kw | 88.6 points |
| 3.0 TDI V6 |
250 hp / 184 kw
(+45%) |
+55% | 50 hp / 37 kw | 42 hp / 31 kw | 83.3 points |
| 4.0 BiTFSI V8 |
420 hp / 309 kw
(+143%) |
+30% | 84 hp / 62 kw | 53 hp / 39 kw | 105 points |
| Vehicle | 6.3 W12 |
|---|---|
| Power (difference from average) |
500 hp / 368 kw
(+189%) |
| Power to torque ratio | 20 % |
| Power per passenger | 125 hp / 92 kw |
| Power to 1 cylinder | 42 hp / 31 kw |
| Power to consumption rate | 79.4 points |
| Vehicle | 4.1 TDI V8 |
| Power (difference from average) |
350 hp / 257 kw
(+102%) |
| Power to torque ratio | 56 % |
| Power per passenger | 88 hp / 64 kw |
| Power to 1 cylinder | 44 hp / 32 kw |
| Power to consumption rate | 85.4 points |
| Vehicle | 2.0 TFSI |
| Power (difference from average) |
211 hp / 155 kw
(+22%) |
| Power to torque ratio | 40 % |
| Power per passenger | 42 hp / 31 kw |
| Power to 1 cylinder | 53 hp / 39 kw |
| Power to consumption rate | 105.5 points |
| Vehicle | 3.0 TFSI V6 |
| Power (difference from average) |
290 hp / 213 kw
(+68%) |
| Power to torque ratio | 31 % |
| Power per passenger | 58 hp / 43 kw |
| Power to 1 cylinder | 48 hp / 36 kw |
| Power to consumption rate | 96.7 points |
| Vehicle | 2.5 FSI V6 |
| Power (difference from average) |
204 hp / 150 kw
(+18%) |
| Power to torque ratio | 18 % |
| Power per passenger | 41 hp / 30 kw |
| Power to 1 cylinder | 34 hp / 25 kw |
| Power to consumption rate | 81.6 points |
| Vehicle | 4.2 FSI V8 |
| Power (difference from average) |
372 hp / 274 kw
(+115%) |
| Power to torque ratio | 16 % |
| Power per passenger | 74 hp / 55 kw |
| Power to 1 cylinder | 47 hp / 34 kw |
| Power to consumption rate | 88.6 points |
| Vehicle | 3.0 TDI V6 |
| Power (difference from average) |
250 hp / 184 kw
(+45%) |
| Power to torque ratio | 55 % |
| Power per passenger | 50 hp / 37 kw |
| Power to 1 cylinder | 42 hp / 31 kw |
| Power to consumption rate | 83.3 points |
| Vehicle | 4.0 BiTFSI V8 |
| Power (difference from average) |
420 hp / 309 kw
(+143%) |
| Power to torque ratio | 30 % |
| Power per passenger | 84 hp / 62 kw |
| Power to 1 cylinder | 53 hp / 39 kw |
| Power to consumption rate | 105 points |
In 2007 Audi A8 horsepower was between 210 and 350 hp or 154 and 257 kW.
Audi A8 horsepower to weight ratio in 2007 is shown in the chart.
Audi A8 horsepower to CC ratio is shown in this graph
| Vehicle | Power (difference from average) | Power to torque ratio | Power per passenger | Power to 1 cylinder | Power to consumption rate |
|---|---|---|---|---|---|
| 2.8 FSI e V6 |
210 hp / 154 kw
(+21%) |
+25% | 42 hp / 31 kw | 35 hp / 26 kw | 75 points |
| 4.2 FSI V8 |
350 hp / 257 kw
(+102%) |
+20% | 70 hp / 51 kw | 44 hp / 32 kw | 83.3 points |
| 4.2 BiTDI V8 |
326 hp / 240 kw
(+88%) |
+50% | 65 hp / 48 kw | 41 hp / 30 kw | 79.5 points |
| 3.0 TDI V6 |
233 hp / 171 kw
(+35%) |
+48% | 47 hp / 34 kw | 39 hp / 29 kw | 77.7 points |
| 3.2 FSI V6 |
260 hp / 191 kw
(+50%) |
+21% | 52 hp / 38 kw | 43 hp / 32 kw | 83.9 points |
| Vehicle | 2.8 FSI e V6 |
|---|---|
| Power (difference from average) |
210 hp / 154 kw
(+21%) |
| Power to torque ratio | 25 % |
| Power per passenger | 42 hp / 31 kw |
| Power to 1 cylinder | 35 hp / 26 kw |
| Power to consumption rate | 75 points |
| Vehicle | 4.2 FSI V8 |
| Power (difference from average) |
350 hp / 257 kw
(+102%) |
| Power to torque ratio | 20 % |
| Power per passenger | 70 hp / 51 kw |
| Power to 1 cylinder | 44 hp / 32 kw |
| Power to consumption rate | 83.3 points |
| Vehicle | 4.2 BiTDI V8 |
| Power (difference from average) |
326 hp / 240 kw
(+88%) |
| Power to torque ratio | 50 % |
| Power per passenger | 65 hp / 48 kw |
| Power to 1 cylinder | 41 hp / 30 kw |
| Power to consumption rate | 79.5 points |
| Vehicle | 3.0 TDI V6 |
| Power (difference from average) |
233 hp / 171 kw
(+35%) |
| Power to torque ratio | 48 % |
| Power per passenger | 47 hp / 34 kw |
| Power to 1 cylinder | 39 hp / 29 kw |
| Power to consumption rate | 77.7 points |
| Vehicle | 3.2 FSI V6 |
| Power (difference from average) |
260 hp / 191 kw
(+50%) |
| Power to torque ratio | 21 % |
| Power per passenger | 52 hp / 38 kw |
| Power to 1 cylinder | 43 hp / 32 kw |
| Power to consumption rate | 83.9 points |
In 2007 Audi A8 horsepower was between 233 and 450 hp or 171 and 331 kW.
Audi A8 horsepower to weight ratio in 2007 is shown in the chart.
Audi A8 horsepower to CC ratio is shown in this graph
| Vehicle | Power (difference from average) | Power to torque ratio | Power per passenger | Power to 1 cylinder | Power to consumption rate |
|---|---|---|---|---|---|
| 3.0 TDI V6 |
233 hp / 171 kw
(+35%) |
+48% | 47 hp / 34 kw | 39 hp / 29 kw | 77.7 points |
| 6.0 W12 |
450 hp / 331 kw
(+160%) |
+22% | 90 hp / 66 kw | 38 hp / 28 kw | 75 points |
| 4.2 BiTDI V8 |
326 hp / 240 kw
(+88%) |
+50% | 65 hp / 48 kw | 41 hp / 30 kw | 79.5 points |
| 3.2 FSI V6 |
260 hp / 191 kw
(+50%) |
+21% | 52 hp / 38 kw | 43 hp / 32 kw | 83.9 points |
| 4.2 FSI V8 |
350 hp / 257 kw
(+102%) |
+20% | 70 hp / 51 kw | 44 hp / 32 kw | 83.3 points |
| Vehicle | 3.0 TDI V6 |
|---|---|
| Power (difference from average) |
233 hp / 171 kw
(+35%) |
| Power to torque ratio | 48 % |
| Power per passenger | 47 hp / 34 kw |
| Power to 1 cylinder | 39 hp / 29 kw |
| Power to consumption rate | 77.7 points |
| Vehicle | 6.0 W12 |
| Power (difference from average) |
450 hp / 331 kw
(+160%) |
| Power to torque ratio | 22 % |
| Power per passenger | 90 hp / 66 kw |
| Power to 1 cylinder | 38 hp / 28 kw |
| Power to consumption rate | 75 points |
| Vehicle | 4.2 BiTDI V8 |
| Power (difference from average) |
326 hp / 240 kw
(+88%) |
| Power to torque ratio | 50 % |
| Power per passenger | 65 hp / 48 kw |
| Power to 1 cylinder | 41 hp / 30 kw |
| Power to consumption rate | 79.5 points |
| Vehicle | 3.2 FSI V6 |
| Power (difference from average) |
260 hp / 191 kw
(+50%) |
| Power to torque ratio | 21 % |
| Power per passenger | 52 hp / 38 kw |
| Power to 1 cylinder | 43 hp / 32 kw |
| Power to consumption rate | 83.9 points |
| Vehicle | 4.2 FSI V8 |
| Power (difference from average) |
350 hp / 257 kw
(+102%) |
| Power to torque ratio | 20 % |
| Power per passenger | 70 hp / 51 kw |
| Power to 1 cylinder | 44 hp / 32 kw |
| Power to consumption rate | 83.3 points |
In A8 Audi A8 horsepower was between 233 and 450 hp or 171 and 331 kW.
Audi A8 horsepower to weight ratio in A8 is shown in the chart.
Audi A8 horsepower to CC ratio is shown in this graph
| Vehicle | Power (difference from average) | Power to torque ratio | Power per passenger | Power to 1 cylinder | Power to consumption rate |
|---|---|---|---|---|---|
| 3.2 FSI V6 |
260 hp / 191 kw
(+50%) |
+21% | 52 hp / 38 kw | 43 hp / 32 kw | 83.9 points |
| 3.7 V8 |
280 hp / 206 kw
(+62%) |
+22% | 56 hp / 41 kw | 35 hp / 26 kw | 75.7 points |
| 4.2 BiTDI V8 |
326 hp / 240 kw
(+88%) |
+50% | 65 hp / 48 kw | 41 hp / 30 kw | 79.5 points |
| 6.0i W12 |
450 hp / 331 kw
(+160%) |
+22% | 90 hp / 66 kw | 38 hp / 28 kw | 75 points |
| 3.0 TDI V6 |
233 hp / 171 kw
(+35%) |
+48% | 47 hp / 34 kw | 39 hp / 29 kw | 77.7 points |
| Vehicle | 3.2 FSI V6 |
|---|---|
| Power (difference from average) |
260 hp / 191 kw
(+50%) |
| Power to torque ratio | 21 % |
| Power per passenger | 52 hp / 38 kw |
| Power to 1 cylinder | 43 hp / 32 kw |
| Power to consumption rate | 83.9 points |
| Vehicle | 3.7 V8 |
| Power (difference from average) |
280 hp / 206 kw
(+62%) |
| Power to torque ratio | 22 % |
| Power per passenger | 56 hp / 41 kw |
| Power to 1 cylinder | 35 hp / 26 kw |
| Power to consumption rate | 75.7 points |
| Vehicle | 4.2 BiTDI V8 |
| Power (difference from average) |
326 hp / 240 kw
(+88%) |
| Power to torque ratio | 50 % |
| Power per passenger | 65 hp / 48 kw |
| Power to 1 cylinder | 41 hp / 30 kw |
| Power to consumption rate | 79.5 points |
| Vehicle | 6.0i W12 |
| Power (difference from average) |
450 hp / 331 kw
(+160%) |
| Power to torque ratio | 22 % |
| Power per passenger | 90 hp / 66 kw |
| Power to 1 cylinder | 38 hp / 28 kw |
| Power to consumption rate | 75 points |
| Vehicle | 3.0 TDI V6 |
| Power (difference from average) |
233 hp / 171 kw
(+35%) |
| Power to torque ratio | 48 % |
| Power per passenger | 47 hp / 34 kw |
| Power to 1 cylinder | 39 hp / 29 kw |
| Power to consumption rate | 77.7 points |
In A8 Audi A8 horsepower was between 233 and 450 hp or 171 and 331 kW.
Audi A8 horsepower to weight ratio in A8 is shown in the chart.
Audi A8 horsepower to CC ratio is shown in this graph
| Vehicle | Power (difference from average) | Power to torque ratio | Power per passenger | Power to 1 cylinder | Power to consumption rate |
|---|---|---|---|---|---|
| 3.0 TDI V6 |
233 hp / 171 kw
(+35%) |
+48% | 47 hp / 34 kw | 39 hp / 29 kw | 77.7 points |
| 3.2 FSI V6 |
260 hp / 191 kw
(+50%) |
+21% | 52 hp / 38 kw | 43 hp / 32 kw | 83.9 points |
| 4.2 FSI V8 |
350 hp / 257 kw
(+102%) |
+20% | 70 hp / 51 kw | 44 hp / 32 kw | 83.3 points |
| 4.2 BiTDI V8 |
326 hp / 240 kw
(+88%) |
+50% | 65 hp / 48 kw | 41 hp / 30 kw | 79.5 points |
| 6.0 W12 |
450 hp / 331 kw
(+160%) |
+22% | 90 hp / 66 kw | 38 hp / 28 kw | 75 points |
| Vehicle | 3.0 TDI V6 |
|---|---|
| Power (difference from average) |
233 hp / 171 kw
(+35%) |
| Power to torque ratio | 48 % |
| Power per passenger | 47 hp / 34 kw |
| Power to 1 cylinder | 39 hp / 29 kw |
| Power to consumption rate | 77.7 points |
| Vehicle | 3.2 FSI V6 |
| Power (difference from average) |
260 hp / 191 kw
(+50%) |
| Power to torque ratio | 21 % |
| Power per passenger | 52 hp / 38 kw |
| Power to 1 cylinder | 43 hp / 32 kw |
| Power to consumption rate | 83.9 points |
| Vehicle | 4.2 FSI V8 |
| Power (difference from average) |
350 hp / 257 kw
(+102%) |
| Power to torque ratio | 20 % |
| Power per passenger | 70 hp / 51 kw |
| Power to 1 cylinder | 44 hp / 32 kw |
| Power to consumption rate | 83.3 points |
| Vehicle | 4.2 BiTDI V8 |
| Power (difference from average) |
326 hp / 240 kw
(+88%) |
| Power to torque ratio | 50 % |
| Power per passenger | 65 hp / 48 kw |
| Power to 1 cylinder | 41 hp / 30 kw |
| Power to consumption rate | 79.5 points |
| Vehicle | 6.0 W12 |
| Power (difference from average) |
450 hp / 331 kw
(+160%) |
| Power to torque ratio | 22 % |
| Power per passenger | 90 hp / 66 kw |
| Power to 1 cylinder | 38 hp / 28 kw |
| Power to consumption rate | 75 points |
In 2004 Audi A8 horsepower was between 220 and 450 hp or 162 and 331 kW.
Audi A8 horsepower to weight ratio in 2004 is shown in the chart.
Audi A8 horsepower to CC ratio is shown in this graph
| Vehicle | Power (difference from average) | Power to torque ratio | Power per passenger | Power to 1 cylinder | Power to consumption rate |
|---|---|---|---|---|---|
| 3.0i V6 |
220 hp / 162 kw
(+27%) |
+27% | 44 hp / 32 kw | 37 hp / 27 kw | 73.3 points |
| 3.0 TDI |
233 hp / 171 kw
(+35%) |
+48% | 47 hp / 34 kw | 39 hp / 29 kw | 77.7 points |
| 3.7 V8 |
280 hp / 206 kw
(+62%) |
+22% | 56 hp / 41 kw | 35 hp / 26 kw | 75.7 points |
| 4.0 TDI V8 32V |
275 hp / 202 kw
(+59%) |
+58% | 55 hp / 40 kw | 34 hp / 25 kw | 70.5 points |
| 4.2i V8 40V |
335 hp / 246 kw
(+94%) |
+22% | 67 hp / 49 kw | 42 hp / 31 kw | 79.8 points |
| 6.0i W12 |
450 hp / 331 kw
(+160%) |
+22% | 90 hp / 66 kw | 38 hp / 28 kw | 75 points |
| Vehicle | 3.0i V6 |
|---|---|
| Power (difference from average) |
220 hp / 162 kw
(+27%) |
| Power to torque ratio | 27 % |
| Power per passenger | 44 hp / 32 kw |
| Power to 1 cylinder | 37 hp / 27 kw |
| Power to consumption rate | 73.3 points |
| Vehicle | 3.0 TDI |
| Power (difference from average) |
233 hp / 171 kw
(+35%) |
| Power to torque ratio | 48 % |
| Power per passenger | 47 hp / 34 kw |
| Power to 1 cylinder | 39 hp / 29 kw |
| Power to consumption rate | 77.7 points |
| Vehicle | 3.7 V8 |
| Power (difference from average) |
280 hp / 206 kw
(+62%) |
| Power to torque ratio | 22 % |
| Power per passenger | 56 hp / 41 kw |
| Power to 1 cylinder | 35 hp / 26 kw |
| Power to consumption rate | 75.7 points |
| Vehicle | 4.0 TDI V8 32V |
| Power (difference from average) |
275 hp / 202 kw
(+59%) |
| Power to torque ratio | 58 % |
| Power per passenger | 55 hp / 40 kw |
| Power to 1 cylinder | 34 hp / 25 kw |
| Power to consumption rate | 70.5 points |
| Vehicle | 4.2i V8 40V |
| Power (difference from average) |
335 hp / 246 kw
(+94%) |
| Power to torque ratio | 22 % |
| Power per passenger | 67 hp / 49 kw |
| Power to 1 cylinder | 42 hp / 31 kw |
| Power to consumption rate | 79.8 points |
| Vehicle | 6.0i W12 |
| Power (difference from average) |
450 hp / 331 kw
(+160%) |
| Power to torque ratio | 22 % |
| Power per passenger | 90 hp / 66 kw |
| Power to 1 cylinder | 38 hp / 28 kw |
| Power to consumption rate | 75 points |
In A8 Audi A8 horsepower was between 220 and 450 hp or 162 and 331 kW.
Audi A8 horsepower to weight ratio in A8 is shown in the chart.
Audi A8 horsepower to CC ratio is shown in this graph
| Vehicle | Power (difference from average) | Power to torque ratio | Power per passenger | Power to 1 cylinder | Power to consumption rate |
|---|---|---|---|---|---|
| 6.0 W12 |
450 hp / 331 kw
(+160%) |
+22% | 90 hp / 66 kw | 38 hp / 28 kw | 75 points |
| 3.0i V6 |
220 hp / 162 kw
(+27%) |
+27% | 44 hp / 32 kw | 37 hp / 27 kw | 73.3 points |
| 4.0 TDI V8 32V |
275 hp / 202 kw
(+59%) |
+58% | 55 hp / 40 kw | 34 hp / 25 kw | 70.5 points |
| 4.2i V8 |
335 hp / 246 kw
(+94%) |
+22% | 67 hp / 49 kw | 42 hp / 31 kw | 79.8 points |
| Vehicle | 6.0 W12 |
|---|---|
| Power (difference from average) |
450 hp / 331 kw
(+160%) |
| Power to torque ratio | 22 % |
| Power per passenger | 90 hp / 66 kw |
| Power to 1 cylinder | 38 hp / 28 kw |
| Power to consumption rate | 75 points |
| Vehicle | 3.0i V6 |
| Power (difference from average) |
220 hp / 162 kw
(+27%) |
| Power to torque ratio | 27 % |
| Power per passenger | 44 hp / 32 kw |
| Power to 1 cylinder | 37 hp / 27 kw |
| Power to consumption rate | 73.3 points |
| Vehicle | 4.0 TDI V8 32V |
| Power (difference from average) |
275 hp / 202 kw
(+59%) |
| Power to torque ratio | 58 % |
| Power per passenger | 55 hp / 40 kw |
| Power to 1 cylinder | 34 hp / 25 kw |
| Power to consumption rate | 70.5 points |
| Vehicle | 4.2i V8 |
| Power (difference from average) |
335 hp / 246 kw
(+94%) |
| Power to torque ratio | 22 % |
| Power per passenger | 67 hp / 49 kw |
| Power to 1 cylinder | 42 hp / 31 kw |
| Power to consumption rate | 79.8 points |
In A8 Audi A8 horsepower was between 310 and 420 hp or 228 and 309 kW.
Audi A8 horsepower to weight ratio in A8 is shown in the chart.
Audi A8 horsepower to CC ratio is shown in this graph
| Vehicle | Power (difference from average) | Power to torque ratio | Power per passenger | Power to 1 cylinder | Power to consumption rate |
|---|---|---|---|---|---|
| 4.2 V8 40V |
310 hp / 228 kw
(+79%) |
+24% | 62 hp / 46 kw | 39 hp / 29 kw | 73.8 points |
| 6.0 W12 |
420 hp / 309 kw
(+143%) |
+24% | 84 hp / 62 kw | 35 hp / 26 kw | 70 points |
| Vehicle | 4.2 V8 40V |
|---|---|
| Power (difference from average) |
310 hp / 228 kw
(+79%) |
| Power to torque ratio | 24 % |
| Power per passenger | 62 hp / 46 kw |
| Power to 1 cylinder | 39 hp / 29 kw |
| Power to consumption rate | 73.8 points |
| Vehicle | 6.0 W12 |
| Power (difference from average) |
420 hp / 309 kw
(+143%) |
| Power to torque ratio | 24 % |
| Power per passenger | 84 hp / 62 kw |
| Power to 1 cylinder | 35 hp / 26 kw |
| Power to consumption rate | 70 points |
In 1995 Audi A8 horsepower was between 174 and 300 hp or 128 and 221 kW.
Audi A8 horsepower to weight ratio in 1995 is shown in the chart.
Audi A8 horsepower to CC ratio is shown in this graph
| Vehicle | Power (difference from average) | Power to torque ratio | Power per passenger | Power to 1 cylinder | Power to consumption rate |
|---|---|---|---|---|---|
| 2.5 TDI V6 |
180 hp / 132 kw
(+4%) |
+51% | 36 hp / 26 kw | 30 hp / 22 kw | 72 points |
| 2.8 V6 30V |
193 hp / 142 kw
(+12%) |
+31% | 39 hp / 28 kw | 32 hp / 24 kw | 68.9 points |
| 2.8 V6 |
174 hp / 128 kw
(+1%) |
+30% | 35 hp / 26 kw | 29 hp / 21 kw | 62.1 points |
| 3.3 TDI V8 |
224 hp / 165 kw
(+29%) |
+53% | 45 hp / 33 kw | 28 hp / 21 kw | 67.9 points |
| 3.7 V8 |
230 hp / 169 kw
(+33%) |
+27% | 46 hp / 34 kw | 29 hp / 21 kw | 62.2 points |
| 3.7 V8 40V |
260 hp / 191 kw
(+50%) |
+26% | 52 hp / 38 kw | 33 hp / 24 kw | 70.3 points |
| 4.2 V8 |
300 hp / 221 kw
(+73%) |
+25% | 60 hp / 44 kw | 38 hp / 28 kw | 71.4 points |
| Vehicle | 2.5 TDI V6 |
|---|---|
| Power (difference from average) |
180 hp / 132 kw
(+4%) |
| Power to torque ratio | 51 % |
| Power per passenger | 36 hp / 26 kw |
| Power to 1 cylinder | 30 hp / 22 kw |
| Power to consumption rate | 72 points |
| Vehicle | 2.8 V6 30V |
| Power (difference from average) |
193 hp / 142 kw
(+12%) |
| Power to torque ratio | 31 % |
| Power per passenger | 39 hp / 28 kw |
| Power to 1 cylinder | 32 hp / 24 kw |
| Power to consumption rate | 68.9 points |
| Vehicle | 2.8 V6 |
| Power (difference from average) |
174 hp / 128 kw
(+1%) |
| Power to torque ratio | 30 % |
| Power per passenger | 35 hp / 26 kw |
| Power to 1 cylinder | 29 hp / 21 kw |
| Power to consumption rate | 62.1 points |
| Vehicle | 3.3 TDI V8 |
| Power (difference from average) |
224 hp / 165 kw
(+29%) |
| Power to torque ratio | 53 % |
| Power per passenger | 45 hp / 33 kw |
| Power to 1 cylinder | 28 hp / 21 kw |
| Power to consumption rate | 67.9 points |
| Vehicle | 3.7 V8 |
| Power (difference from average) |
230 hp / 169 kw
(+33%) |
| Power to torque ratio | 27 % |
| Power per passenger | 46 hp / 34 kw |
| Power to 1 cylinder | 29 hp / 21 kw |
| Power to consumption rate | 62.2 points |
| Vehicle | 3.7 V8 40V |
| Power (difference from average) |
260 hp / 191 kw
(+50%) |
| Power to torque ratio | 26 % |
| Power per passenger | 52 hp / 38 kw |
| Power to 1 cylinder | 33 hp / 24 kw |
| Power to consumption rate | 70.3 points |
| Vehicle | 4.2 V8 |
| Power (difference from average) |
300 hp / 221 kw
(+73%) |
| Power to torque ratio | 25 % |
| Power per passenger | 60 hp / 44 kw |
| Power to 1 cylinder | 38 hp / 28 kw |
| Power to consumption rate | 71.4 points |